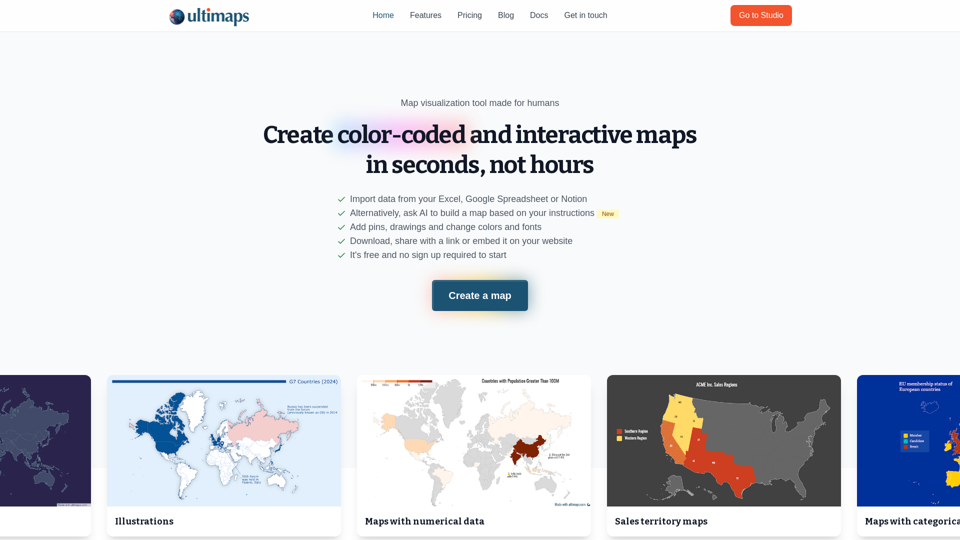
Ultimaps — Color Coded Maps
Ultimaps is a powerful color-coded map creation tool that enables users to create interactive and visually appealing maps in seconds. With the ability to import data from various sources, automatic color-coding, and customization options, Ultimaps simplifies the map-making process and empowers users to create engaging visualizations without any coding. Whether you need sales territory maps, presence maps, or illustrations, Ultimaps has you covered with its comprehensive set of features and a user-friendly interface.

What is Ultimaps — Color Coded Maps?
Ultimaps is a powerful map visualization tool designed for humans, allowing you to create color-coded and interactive maps in seconds. Whether you want to visualize numerical data, sales territories, categorical data, pins, or illustrations, Ultimaps has got you covered. With the ability to import data from Excel, Google Spreadsheet, or Notion, as well as the option to let AI build a map based on your instructions, Ultimaps makes map creation effortless. Customize your maps with personalized colors, fonts, and drawings to make your story clear and engaging. The best part? Your work is auto-saved, so you never lose your progress. Plus, with interactive elements like tooltips and popups, you can truly bring your maps to life. Ultimaps offers a free tier with unlimited maps and the option to export and share your creations. For more advanced features and priority support, consider upgrading to the Pro or Custom plans. Start creating stunning and interactive maps with Ultimaps today!
Ultimaps — Color Coded Maps Key Features?
Create color-coded and interactive maps in seconds, not hours
Import data from Excel, Google Spreadsheet, or Notion for easy map creation
Add pins, drawings, change colors, and fonts to personalize your maps
Automatically color-code your maps based on imported data with adjustable legends
Enhance visualizations with custom colors, fonts, and interactive elements
Auto-save feature ensures you never lose your work
Build interactive maps without any coding knowledge
Easily share and embed your maps on websites or via links
How to use Ultimaps — Color Coded Maps?
1. Go to Studio to access the main menu
2. Create a color-coded and interactive map in seconds
3. Import data from Excel, Google Spreadsheet, or Notion
4. Add pins, drawings, and change colors and fonts
5. Download, share with a link, or embed on your website
6. Personalize your map with custom colors and fonts
7. Auto-save your visualizations to never lose your work
8. Build interactive maps with no coding required